Fall soil sampling is right around the corner. In the past, it may have been sufficient to dig a composite sample across a couple spots in the field to get a rough idea of what your soil needed. Today, we have more precise methods of determining the best way to spend our fertility dollars.
We know some growers are still questioning whether or not soil sampling is worth it. Our question back to you is how do you know what to apply without it? Without soil data, you are either applying too much fertilizer and wasting your dollars… or you are applying too little, shorting your crop and, again, wasting your dollars.
At Wells Ag Supply, we stand behind the quality and depth of data BaselineRx provides. Several factors separate BaselineRx from the industry standard grid sampling and lab testing.
GATHERING SAMPLES
Instead of sampling your field in 2.5 acre grids, BaselineRx maps your field and develops five unique soil zones based on NIR imagery, topography, soil composition and water flow patterns. Each zone is going to react and hold nutrients differently. BaselineRx accounts for that.
Our team is prepared to sample fields, or growers can sample their own fields.
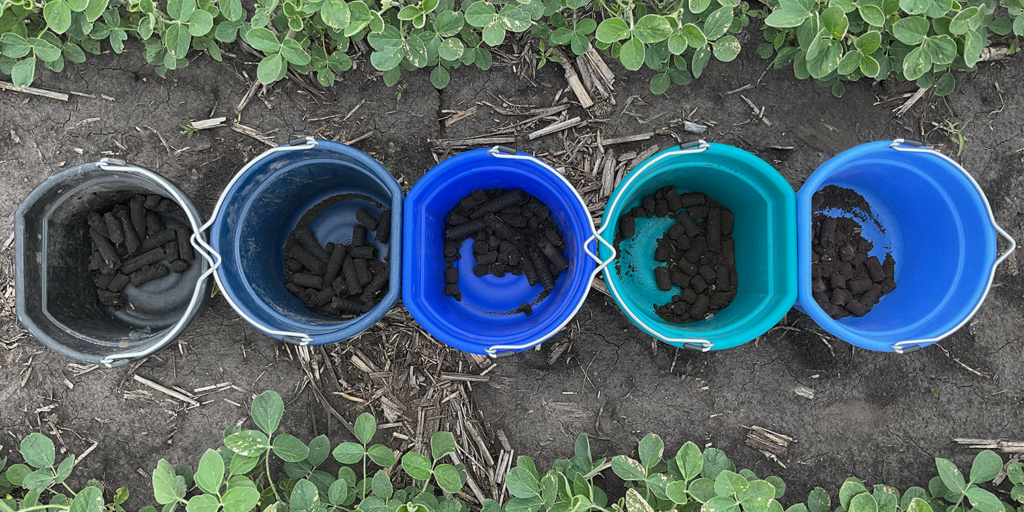
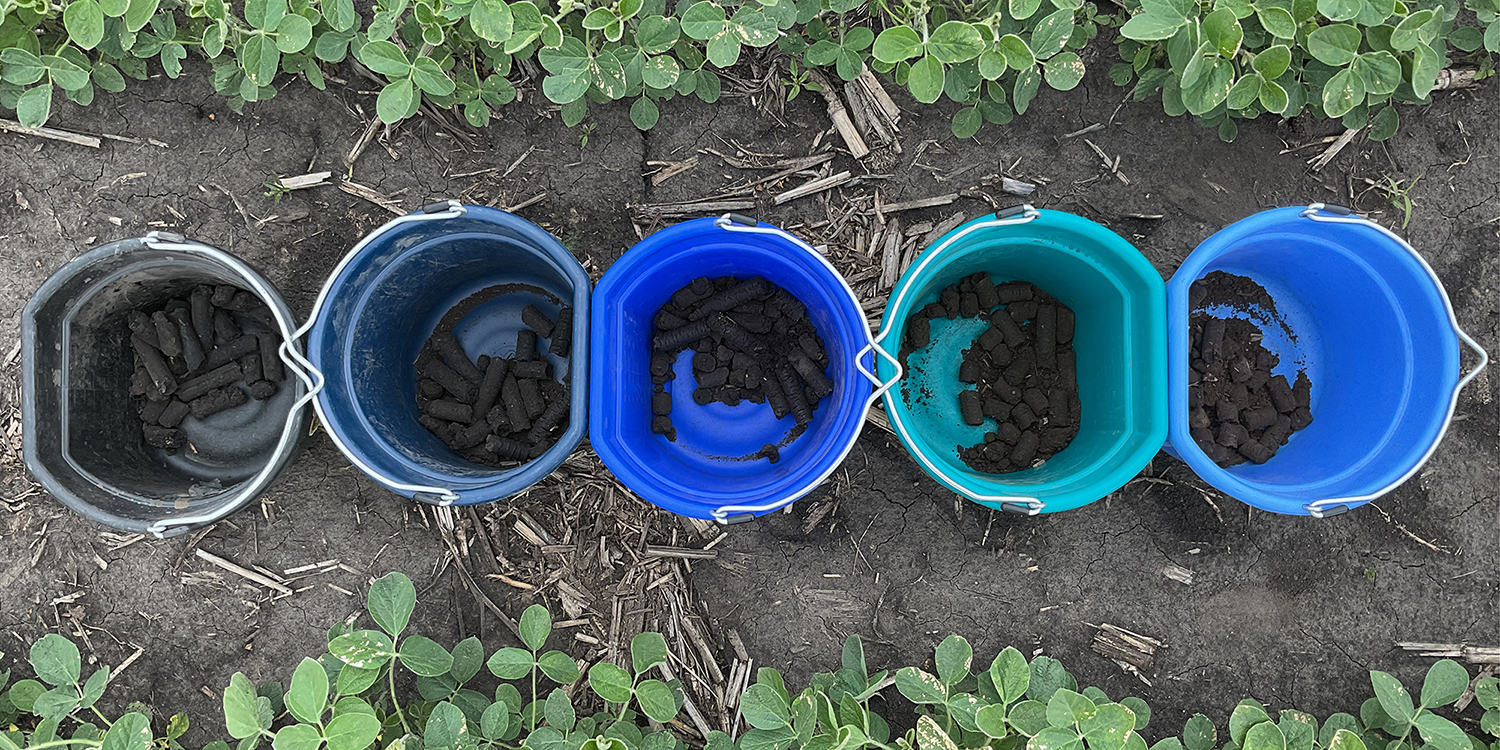
In this photo, you can see soil structure differences across five zones. Each zone is going to react and hold nutrients differently.
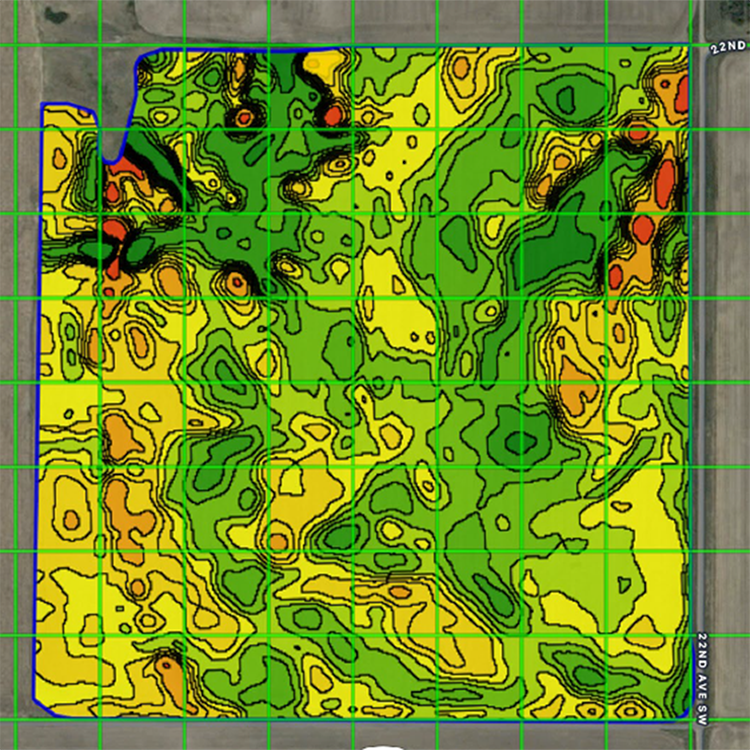
GRID SAMPLING
A grid is laid over your field and samples are taken in each section. The varying topographic and soil differences in each grid are not accounted for.
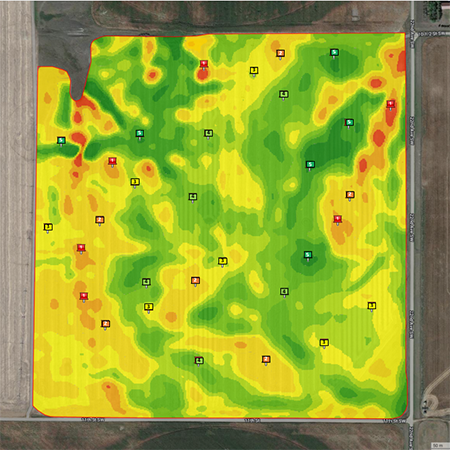
ZONE SAMPLING
Zones are based on water flow, soil texture and topography… not soil type or geographic location. One soil type might actually be composed of several zones.
ANALYSIS
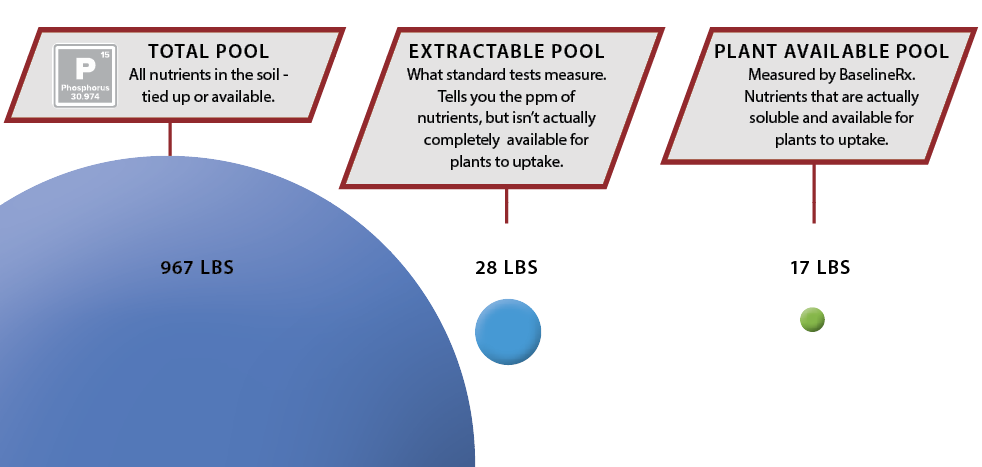
Grid sampling and standard testing is outdated and provides nothing better than a “guess” at what is happening in your soil. Standard tests tell us the parts-per-million of nutrients in the soil, also known as the “Extractable Pool”. [See the example using phosphorus below.] We consider this data to be skewed – the chemicals used to extract those nutrients from the soil sample are much harsher than what your crop’s roots can actually extract.
BaselineRx analyzes samples with the Indicator Complete soil test through Next Level Ag Labs. In addition to the metrics that a standard test provides, the Indicator Complete test allows us to see how much of the soil’s nutrients are available in a form the plant can actually uptake. This is known as the “Plant Available Pool”. The Indicator Complete test is able to analyze how capable your soil is at releasing nutrients to plants in a soluble form. Lastly, in the Indicator Max package upgrade, growers can also see the amount of nutrients in their “Total Pool”.
The BaselineRx zones and Indicator Complete test combined help us understand how much nutrition the soil can provide a crop, what nutrients we need to apply, when is the best time to apply those nutrients, what form of the nutrient is ideal, and ideal application methods. These answers all lead to better nutrient efficiency.
BIOLOGICAL ACTIVITY
The efficiency of the traditional fertilizers we apply is bad – at best. On average, only $0.20 for every dollar spent on macro and micro nutrients is actually getting taken up into the plant. The rest of your dollar is getting tied-up in your soil and must go through a biological process in order to become plant available.
The best way to engage the soil’s biological system is through soluble carbon, otherwise known as water extractable organic carbon (WEOC). More soluble carbon in your soil results in higher biological activity. WEOC is the
food source for biology. Higher biological activity creates more enzymes. Enzymes are the compounds that free up your tied-up nutrition. More enzymes create more plant available nutrients. Soluble carbon is the critical factor – it drives this process, as well as holds those nutrients in their available form.
As a farmer, we want to be confident in our decision. If we spend money on a nutrient, we want to know it is in the right place. If we’re fertilizing based on only the “Extractable Pool” data instead of the “Plant Available” data, then we’re doing our dollars a disservice.
Ultimately, the goal is to increase the size of that “Plant Available Pool” through the use of the right products applied at the right time. Applying MAP is absolutely going to inflate your “Plant Available Pool” momentarily, but the lower your soluble carbon is, the quicker that P will get tied up in the “Extractable Pool” and “Total Pool”.
PRESCRIPTIONS
BaselineRx looks at upwards of twelve different metrics in order to supply fertilizer recommendations. Take that compared to traditional fert recommendations which only look at one or two metrics, and you’ll see how much more accurate and robust these prescriptions are.
BaselineRx is going to recommend a prescription that encourages more soluble carbon in your system. Overuse of mineral fertilizers, pH ranges outside of 6.0 – 7.0, lack of crop rotation, and excessive tillage are all factors that negatively affect the amount of soluble carbon, biology, and enzyme production in your soil.
HOW TO GET STARTED
First, reach out to us to submit your field boundaries for zone-creation. Then we can either send a team to take the samples, or you can follow our sampling protocol and collect them yourself. Shortly after, your Indicator Complete results will come back and we will go over the report with you. A plan will be established based on the recommendations.
As always, our goal is to Empower the Farmer to WIN. Not ready to implement all the recommendations in one year? That’s fine. We will always keep your goals top-of-mind. BaselineRx simply gives us the full picture to be able to do so.
View the Soil Sampling Webinar – where we cover this information in depth!


